Seasonal businesses need an efficient budgeting across the year based on the trends. As for a regular business we could have a monthly budget and alter it depending on the conversion/ ROAS while seasonal business needs a different approach. I am writing down my strategy on one such business, the Florists with budget allocation for two countries, US & Australia. .
Florist Budgeting Using Google Trends and Claude CoWork
We manage a significant number of florist accounts across our portfolio from US and Australia, and clients always enquire on Ad budget for February and May versus the rest of the year. Earlier we used to analyze the past year’s performance, ROAS/CPL to come up with a profitable budget allocation. This is a very time consuming job with not so accurate data as we were depending only on the performance of the particular account. We also used Google trends earlier but was not fully confident on the data as there were extraordinary spikes even in the off-season. And then it was done manually.
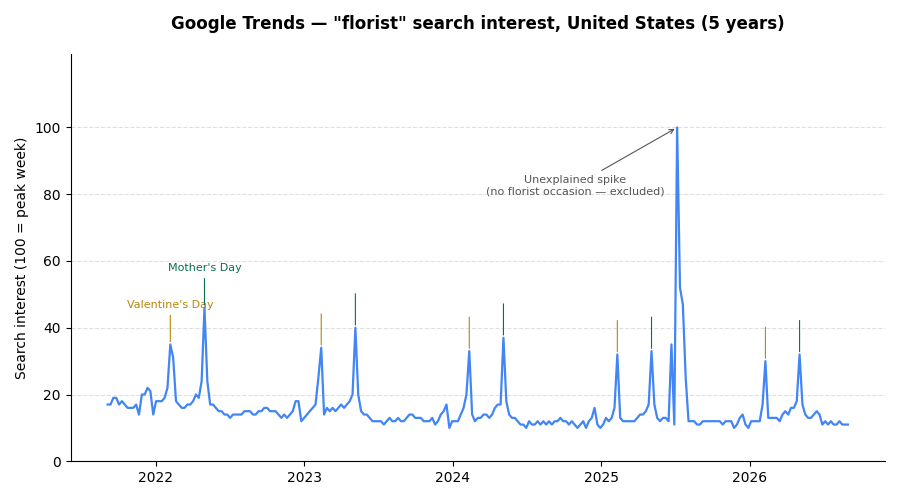
Caution: This is not a fully automated workflow as there are issues in the older Google trends data. You need to scrutinize the data even before feeding it to Claude co work. In the middle of 2025, Google rolled out major updates to its AI Overviews globally. It had as system name query fan-out which breaks a single prompt into a batch of multiple sub topic searches which lead to unrealistic spikes. This was observed for the two countries and there was no festival or important events going on in July. So I have ignored the data.
I pulled 5 years of Google Trends data for the search term "florist" for the United States, and then for Australia which was fed to Claude co work to determine the seasonal curve to help budgeting for the seasonal and non-seasonal duration.
Task-1: Pulling and reading the US seasonality curve for US florists and determine the budget
Approximate Time with Claude: 25 mins | Without Claude: 3-4 hours | Time saved ~3 hours
I opened Google Trends, set the term to "florist," region to United States, range to the past 5 years, and downloaded the weekly CSV — 261 rows of raw search-interest index, scaled 0-100 against the single highest week in the whole window. Here's the curve for the search term florist in the past 5 years. As I cautioned earlier there is a ghost spike on July 2025 which I ignored.
 US Florist Trends
The prompt I gave Claude:
"I've attached 5 years of weekly Google Trends data for 'florist' in the United States. Find the recurring seasonal peaks, tell me which calendar occasions they line up with, and turn the pattern into a suggested percentage split of a monthly PPC budget."
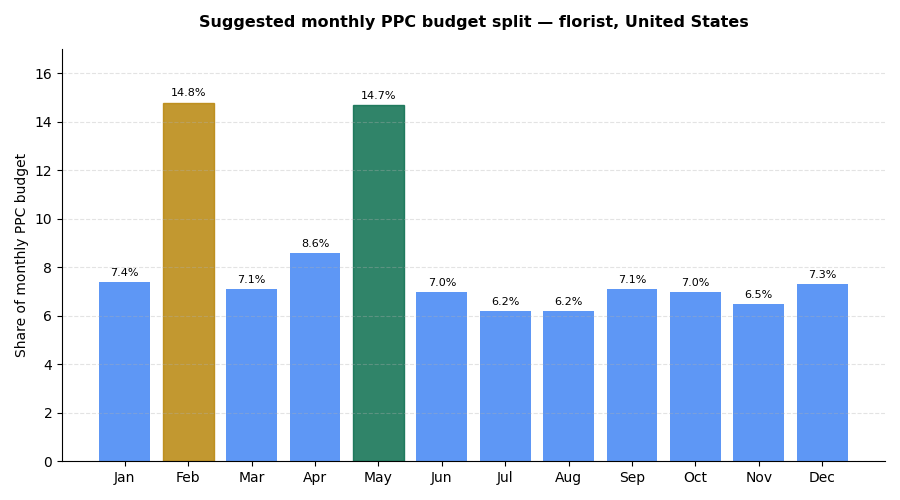
Claude co work results were obvious with two peaks, one on the Valentine’s Day period and before Mother's Day, both recurring every single year in the data going back to 2021. Averaged across all 5 years, Valentine's week and Mother's week each run at roughly 11.5% of the year's total search interest, against 6.5-8% for the off-season months.
It suggested the below budget for the months. The CPCs and conversion rates also increase in peak weeks, not just volume.
Account Manager Action – In case the budget was not spent as expected for the month for eg. Feb budget until Feb 14th, you need to act on it and reduce the budget for the rest of the month.
 Suggested monthly PPC budget split florist, US
Task-2: : Pulling and reading the seasonality curve for Australian florists and determine the budget
Approximate Time with Claude: 20 mins | Without Claude: 3 hours | Time saved ~2.5-3 hours
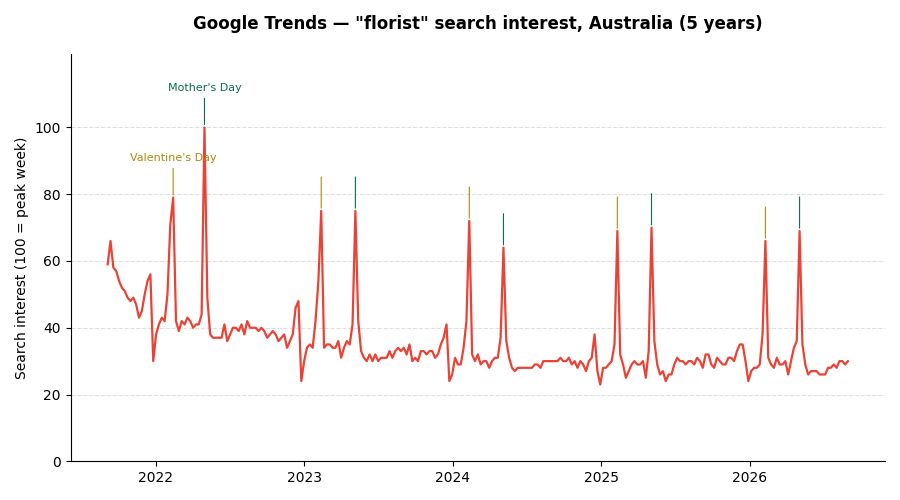
I assumed that Australia's curve would be different as they had a different set of events, occasions. I pulled the same 5-year "florist" data from Google trends for Australia and ran the same prompt mentioned earlier.
 Google Trends "florist" search interest, Australia (5 years)
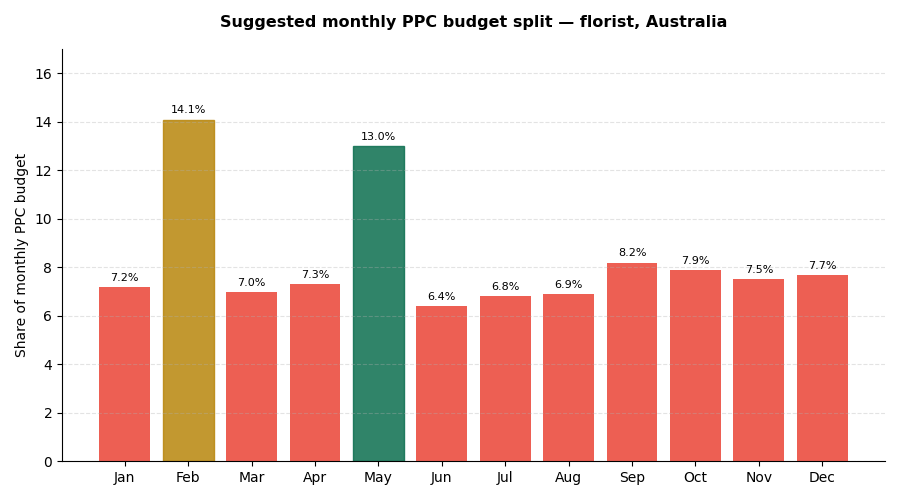
The result was not as different from the US data as the peak months are the same as US, Valentine's Day and Mother's Day. Australia's Mother's Day falls on the same date as the US (second Sunday of May). Since Australia’s Father's Day falls in early September (not June as in the US), which was one of the key differences. The 5-year average of Aussie shows September running slightly above the rest of the off-season months.
Here's the Australian budget split that Claude co work suggested
 Suggested monthly PPC budget split florist, Australia
How to move forward with the suggestions?
Word of Caution: Never run the Google trends for the whole country. For eg. If the florist deliver only in Sydney, or any suburb only use that trends data as there will be local events happening based on the locality which may trigger more searches.
Our account managers use this suggestions for Pmax and Search campaigns as a starting monthly budget cap schedule but not a strict rule for the budget. An expert account manager should always look into Google Ads Campaign Management to run successful campaigns.
If you manage florist accounts (or any heavily occasion-driven local business) and want this kind of seasonal budget model built out for your own market feel free to message me on linkedin.
Updated 09-10-26. There had been several requests from florists in Dubai, AbuDhabhi and so I did an analysis with claude and here is the result.
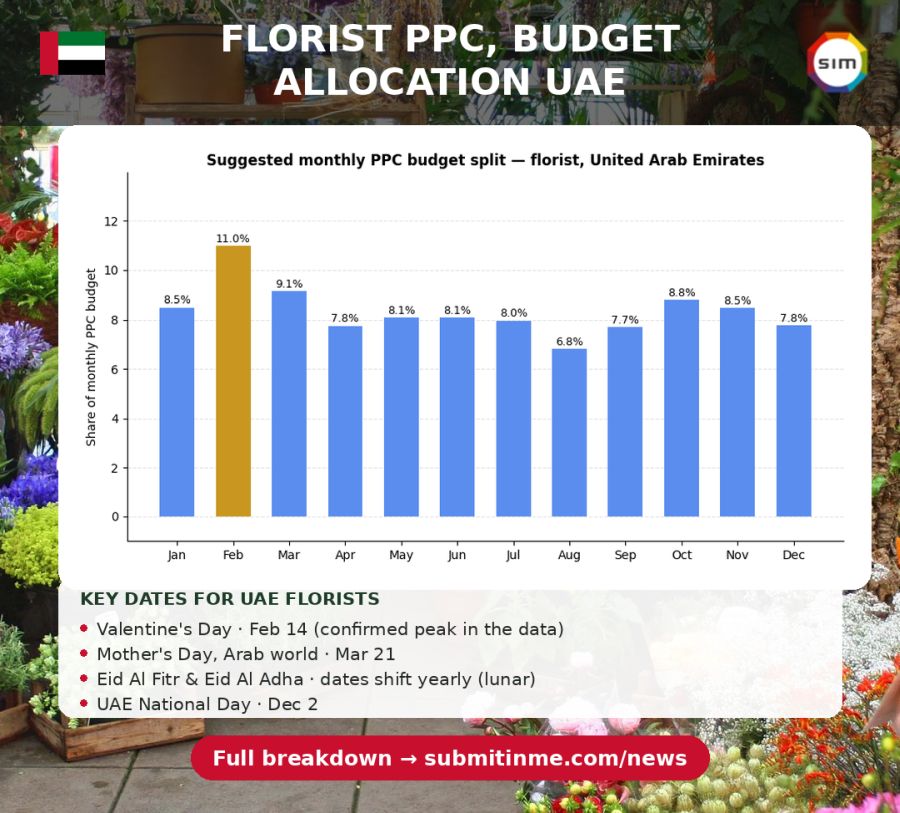 florist uae ppc
Updated 01-10-26
We just launched an exclusive Digital Marketing for Florists Service. For agencies we offer white label digital marketing for florists, flowershops. You can contact us for more details.
On a lighter note, while I was researching for this article came across some weird stuff which made me laugh uncontrollably. Bro who came on parole was sent back to prison without parole for sniffing butts. Watch the video here